In a recent interview with AgTechNavigator, I made some statements about agtech exits, suggesting higher corn prices are closely linked to increased venture capital (VC) exit activity in the agtech sector.
I thought it might be helpful to showcase the data more thoroughly, so that those involved in agtech can consider further consequences or can offer competing hypotheses.
Weaknesses in the hypothesis include incomplete exit data. It is historic too, rather than predictive. If the data changes, then the conclusions will too.
Agtech exits muted
Venture investing is a game of awesome exits rather than grand entrances. What then are the exit prospects of the agtech sector as a whole? When are agtech companies bought, for how much and by whom, and what are the consequences for small companies and their backers?
How are they going to exit?
By IPO? Well, actually, no. There was an IPO rate of 0.5 companies per year in 2004-2019. Then during an extraordinary three-year special-purpose acquisition company (SPAC( period in 2019-22, an average of three per year. But none since.
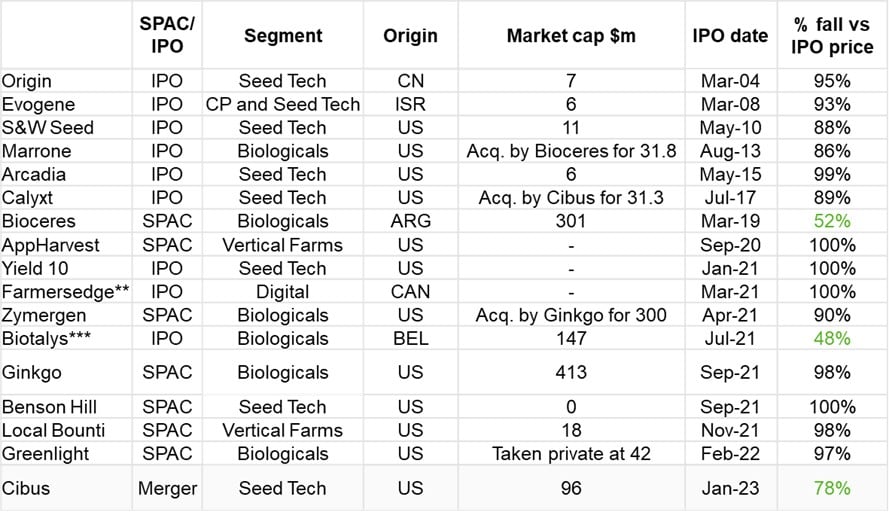
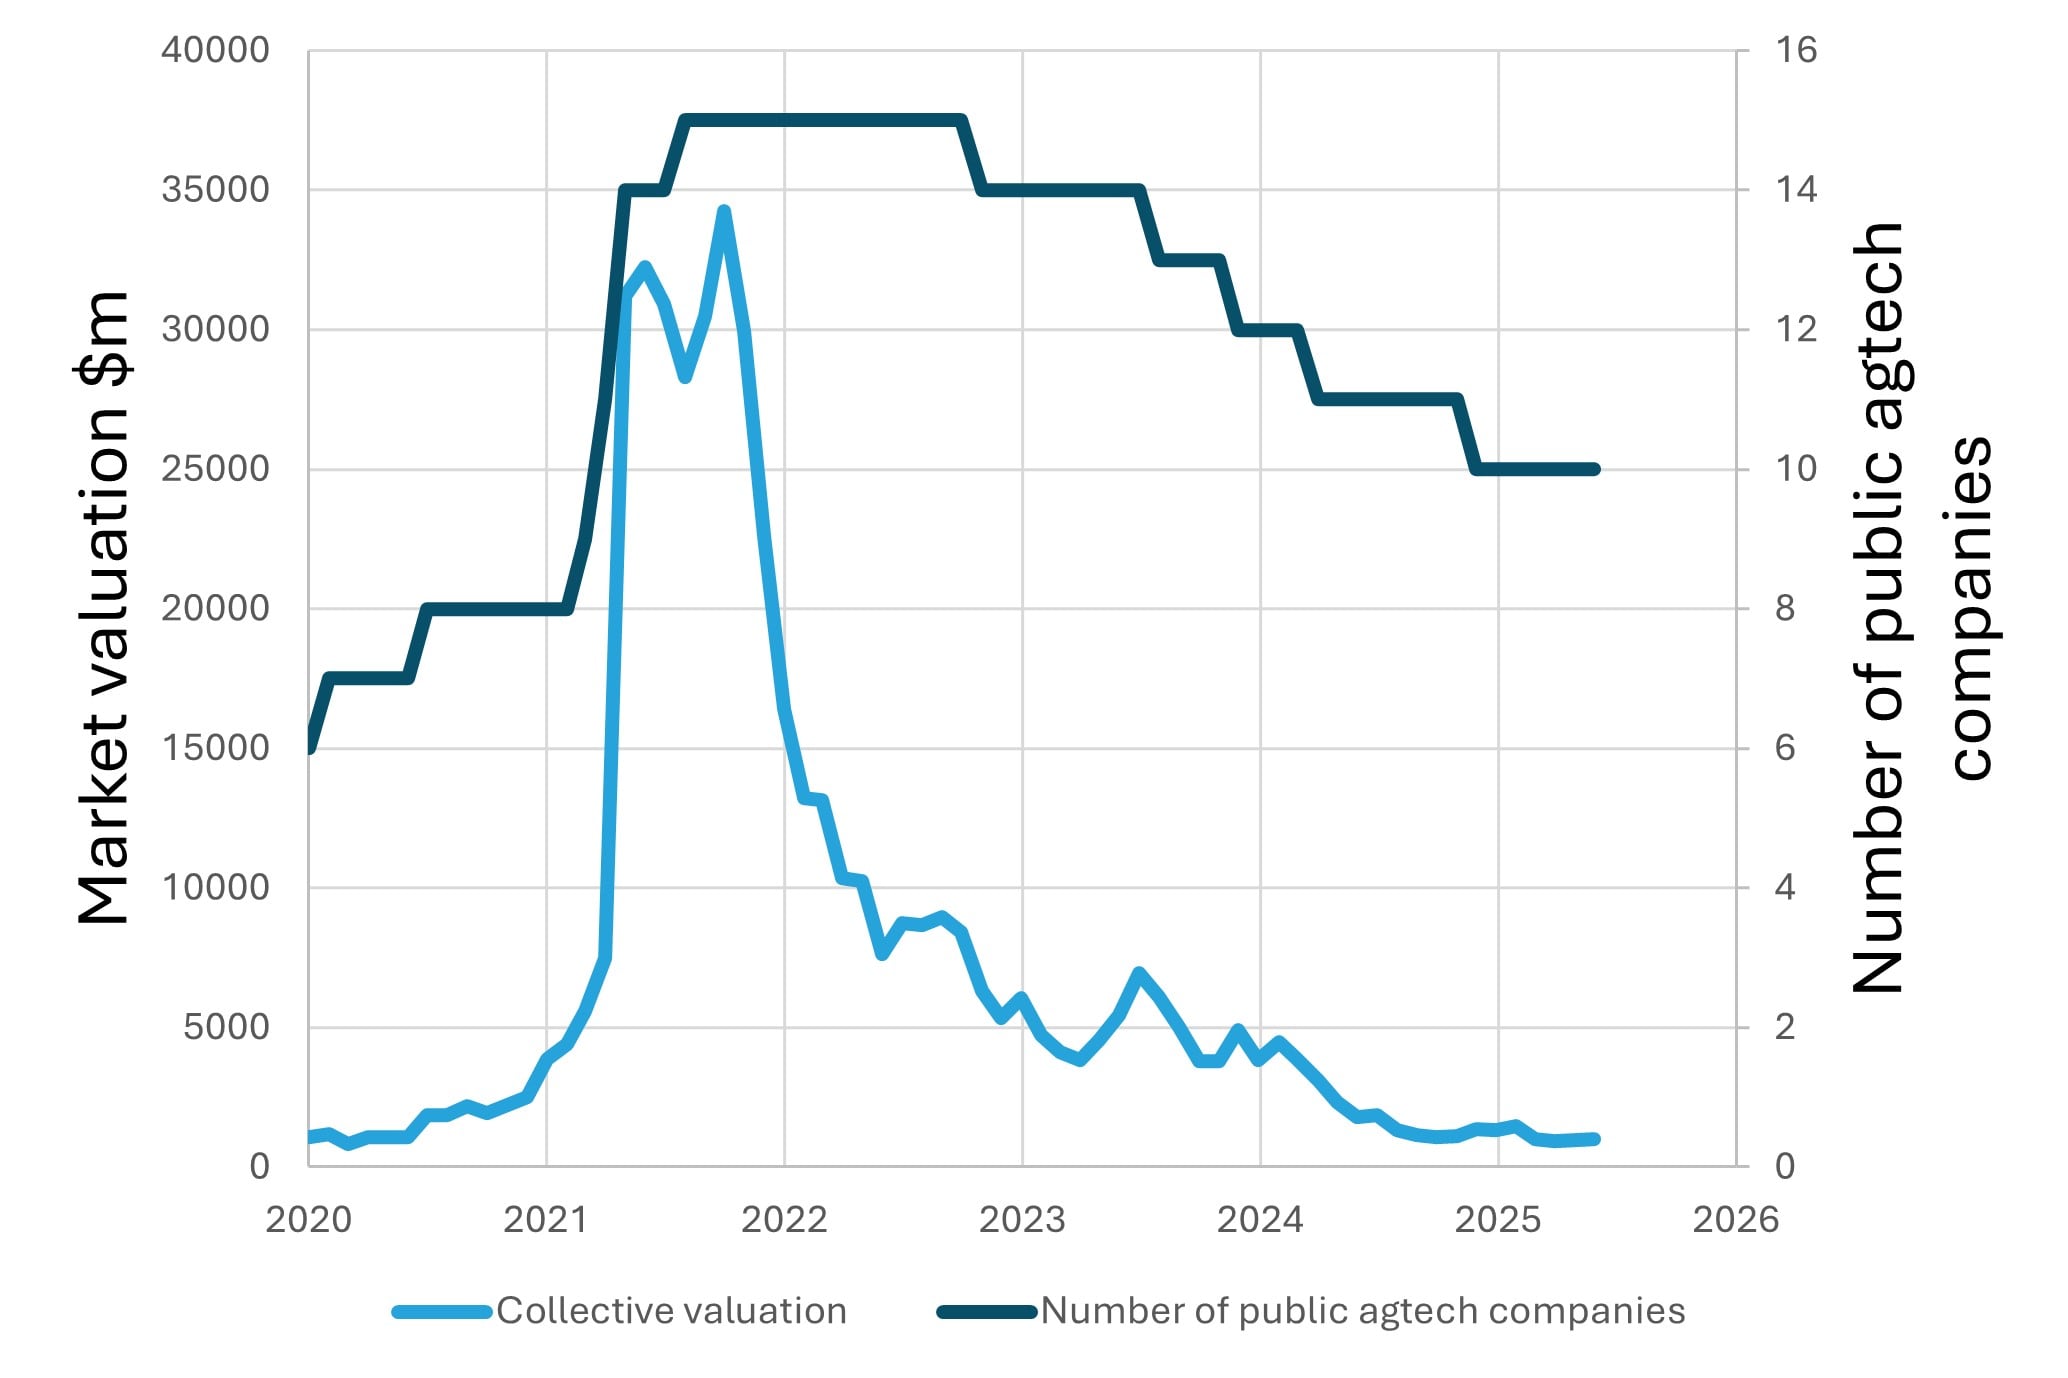
The number of public agtech companies peaked at just 15 with a combined valuation of about $34b. This has been deflating ever since: many have gone private or gone bust, just three have lost less than 80% value since flotation (those highlighted in green in Table 1), and the entire value of public agtech stocks is now worth $1b, a 97% decline on their peak valuation. A significant chunk of that value is in Ginkgo’s balance sheet cash.
Sell to private equity? There are some exits to PE in biologicals and inputs. But it remains an unlikely path, as only four were identified that were less then 20 years old at the time of acquisition (most VC funds have 10 year lives, so this is being generous).

Sell by trade sale? Since January 2007, about 50 companies[1] have sold for $20m or more each to agchem/OEMs. My shorthand acronym for these companies is BLACKJACKS[2] Measured by the number of transactions, trade sales are therefore the lead exit mechanic. The two tables below are split according to buyer type – either agchem or OEMs.
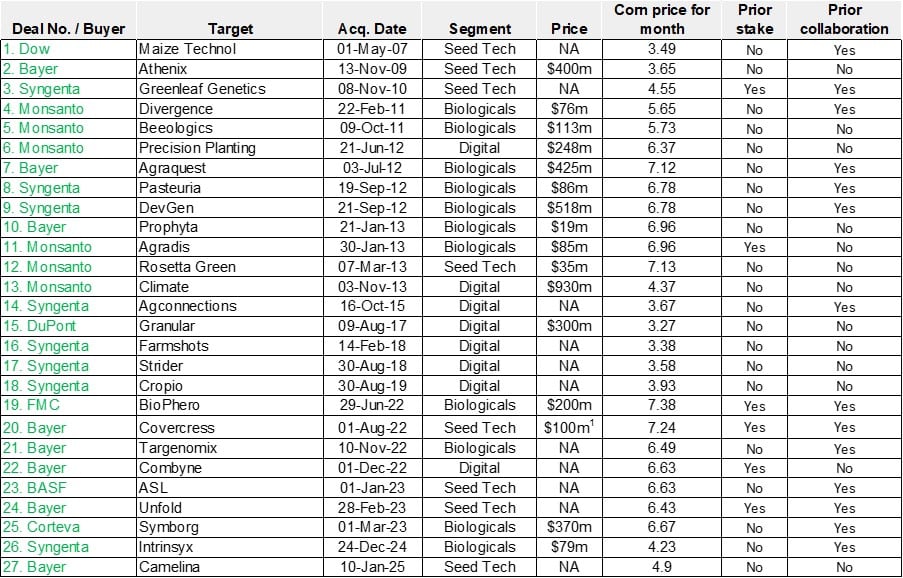
Note 1. Rough estimate based on Bunge reporting of net gain on sale of their share
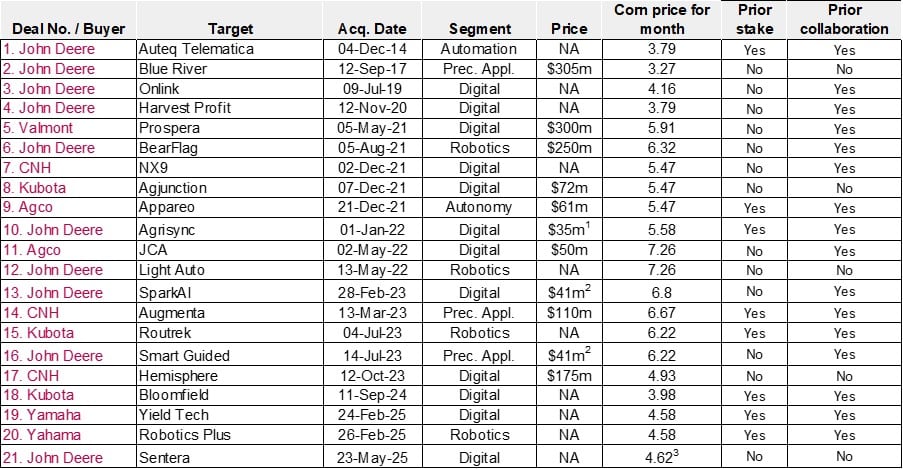
Note 1. My crude estimate based on Deere reporting – average of four transactions priced at $134m collectively
Note 2. In Deere reporting, SparkAI and Smart Guided were priced at $82m collectively, but the actual split was not disclosed. This amount is divided evenly in the table
Note 3. USDA price for month of May not yet published at the time of writing. This is the monthly corn price for April
Trade sales – “Try before you buy”
A lead indicator for acquisition intent might be whether a company has received a CVC equity stake or were collaborating with the acquirer, and this turns out to be the case. Tables 3 and 4 list prior equity stakes and collaborations. Prior to 2021, there have been 22 identified transactions, just three of which had a prior equity stake (14%) and 10 (45%) had a collaboration.
From 2021 onwards, there have been 26 identified transactions, 11 of which had a prior equity stake (42%) and 20 (77%) had a collaboration. Based on this, acquirers appear increasingly to “try before they buy” to get to know targets.
When are transactions taking place?
Agchem as the acquirer: The chart below shows USDA monthly corn prices since Jan 2007 in $/bushel, plotted together with the transaction number from Table 3 above.
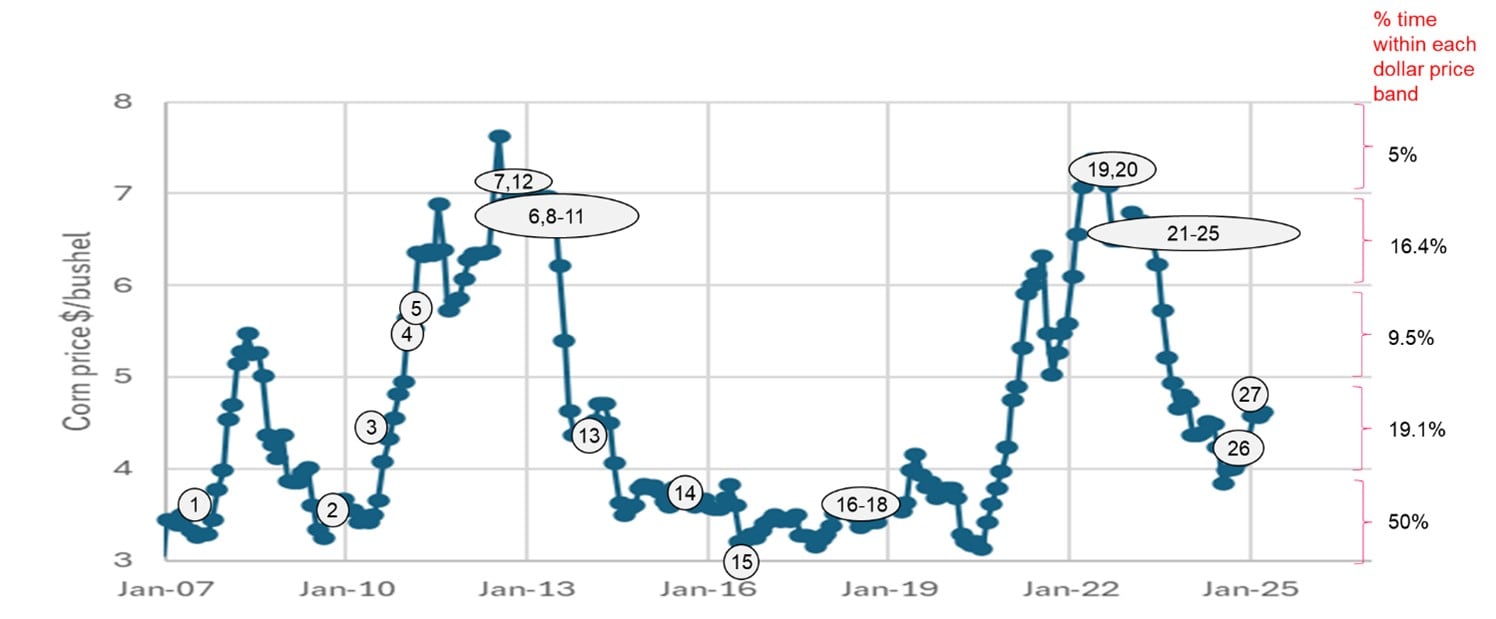
Since January 2007, exactly half the time, the USDA monthly corn price was less than $4/bushel, and about 80% of the time, less than $6/bushel. At first glance, there appears to be a mild positive correlation with corn price. But the impact of corn price on acquisition rate is made even clearer in Table 5, where the number of transactions and spend are annualised.[3]


Table 5 shows that for trade sales to agchem, the “spend rate” ($m/year) is 10.9x higher when corn price is >$7/bushel versus <$4/bushel (i.e. $829m/year vs $76m/year). The “deal rate” (deals/year) is 5.7x higher when corn prices are >$7/bushel versus <$4/bushel (i.e. 4.4 deals per year versus 0.77 deals per year).
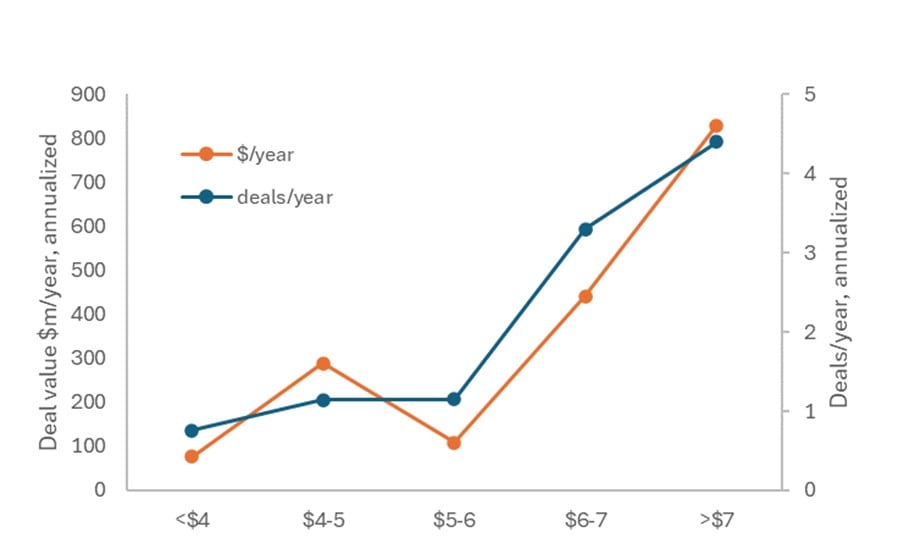
The sole confounding data point that rather ruins a neat correlation for $/year in trade sales to agchem (see Figure 3) is, inevitably, the largest deal of them all, Monsanto’s 2013 acquisition of Climate for $930m. This transaction was announced in November 2013 when corn price was just $4.37/bushel for the month. But I note that this was off the back of a sustained period of 20 months of corn priced at over $6/bushel, and it is highly likely acquisition discussions started during that period.
OEMs as the acquirer
The OEM deals are concentrated towards recent years (18 of 21 agtech acquisitions in the last five years) as OEMs undergo massive digitization of tractor operations.
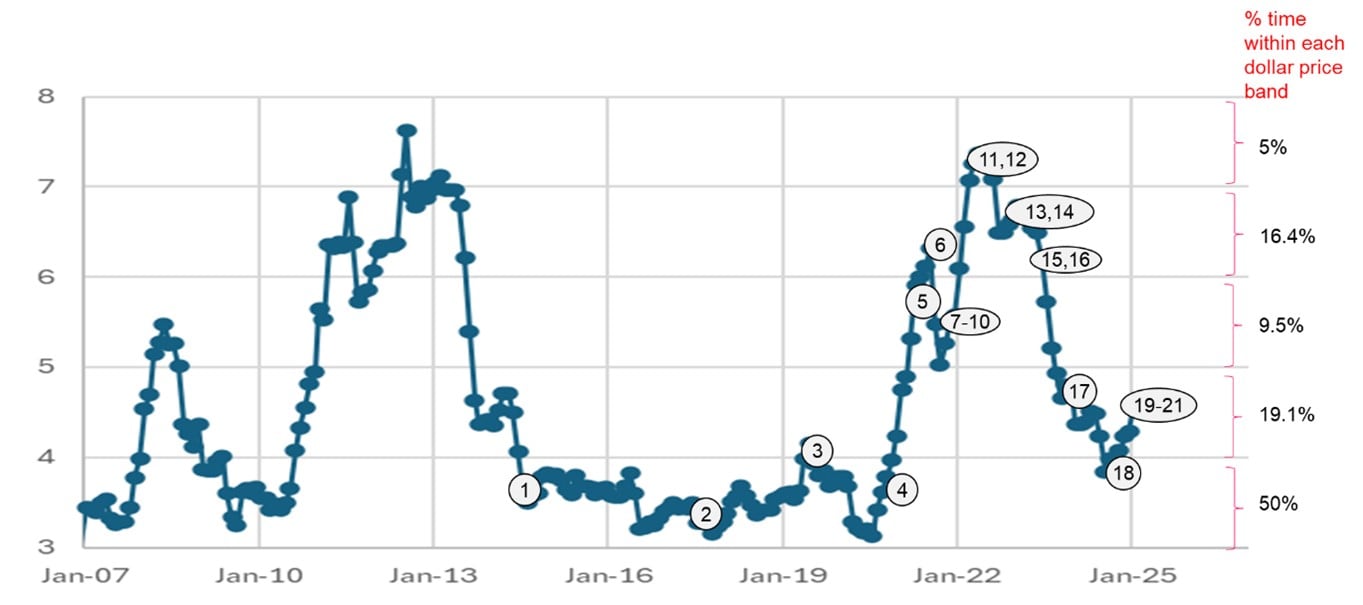
The correlation with OEM M&A activity and corn prices appears here too, albeit not as neatly or as pronounced as with agchem acquisitions.

Notwithstanding considerable variation, the table shows that for sales to OEMs, the “spend rate” ($m/year) is 1.6 – 7.9x higher when corn price is <$4 versus >$5 (i.e. up to $269m/year vs $33m/year). The “deal rate” (deals/year) is also 3.7 - 6.5x higher when corn prices are >$5/bushel versus <$4/bushel (i.e. up to 2.87 deals per year versus 0.44 deals per year).
How much is paid?
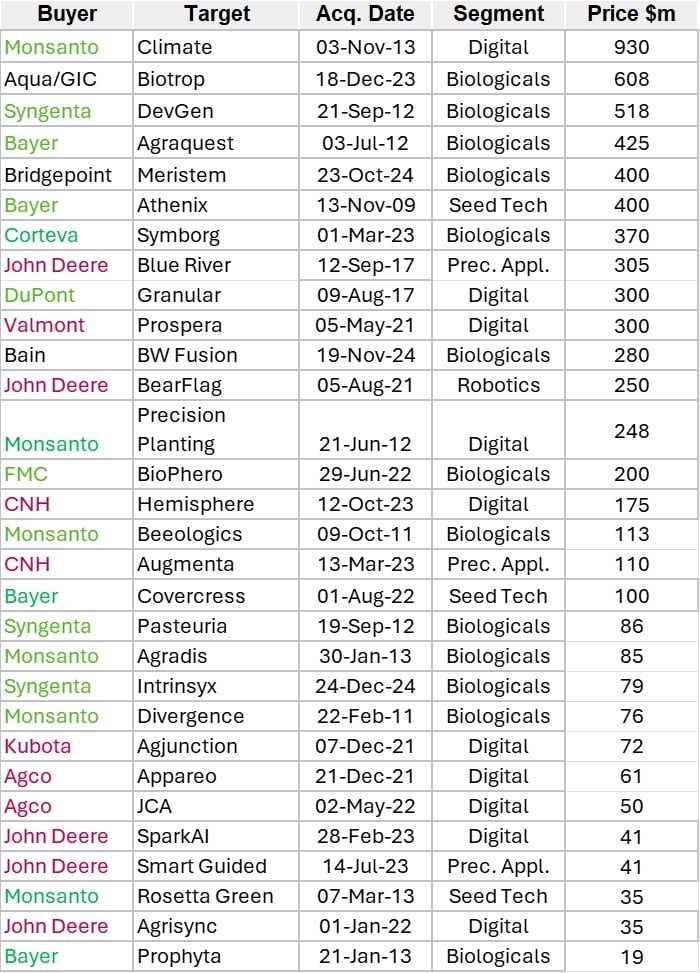
The median price paid for a top ten exit is $400m. As VCs needs a >3x return (Carta data shows the empirical multiple between rounds is somewhat less, at between 2.2x to 3x for Series A-C), to get a new investor to participate in the last round would mean the last pre-money should be no more than say, $100m, with a raise of no more than $35m.
In fact, if we use Carta data again for amounts raised by VC backed companies, then these show that the average company raises $35m in total up to Series B. If the exit valuations in agtech remain as described here, then capital efficiency and minimizing burn and capital raised is vitally important in agtech.
Summary and consequences
I hope readers can help complete the gaps in the data itself. Comments are welcome too. My conclusions for consideration by agtech investors and leaders of agtech companies are as follows:
- Trade sales to the ag industry (OEMs and agchem) have been the key exit mechanic for the majority of agtech companies for almost 20 years, and likely to remain so. Should the exit landscape for ag-related companies (e.g. perhaps using fintech, e-commerce) expand beyond this group, then the observations here may well not apply.
- The acquisition rate by both OEMs and agchem companies correlates with high corn prices, the annualised rate of which increases significantly when the corn price is >$6/bushel. Targets (especially where the buyer is likely to be an agchem company) need to be ready not just when they themselves are ready, but when prospective acquirers are ready too.
- In the last five years, and now armed with a CVC unit, it appears that acquirers are “trying before they buy” via a collaboration and/or an equity stake. This means agtech companies should try to have a CVC as an investor and/or a collaboration with OEMs or agchem companies. A trade sale is otherwise less likely.
- Capital efficiency is vitally important: if selling to agtech/OEMs, agtech companies should raise less than $50m in total ($35m for last round, $15m for all prior rounds). Anything above that requires a leap of faith against the empirical data.
- The average of top ten exit prices is $400m. Boards and their companies should keep intermediate paper valuations realistic and limit round sizes, or exits will either exclude trade sales, or involve incomplete waterfall[1] payouts, the latter to the detriment of junior stock, often held by founders.
[1] The structure that defines how the proceeds from an exit are distributed among the different shareholders
Corn prices: Things to think about
In conclusion, high corn prices appear to create better circumstances for agtech acquisition, as this puts more money in the hands of the supply chain: farmers who then invest more in their farm to maximise yields, as well as input suppliers which benefit from increased demand and then have capacity to consider agtech acquisitions that fill gaps in their capabilities.
However, high corn prices also cause political instability or are a result of global disruption to supply chains - the Arab Spring of Dec 2010 and the invasion of Ukraine by Russia in Feb 2020 were both associated with increases in corn prices. Longer ago, tariffs imposed by the UK Corn Laws (then meaning all grains) raised prices by reducing free trade and the affordability of food. Thus, at some level, corn prices are an Unhappiness Index. We should be careful what we wish for.
Note that the views expressed here are the author’s own, and do not necessarily reflect the views of SGV or Syngenta Group
References
[1] I would welcome learning about more transactions that qualify as VC-backed agtech exits. Criteria are that they sold for more than $20m, and were less than 20 years old at the time of exit. There are also many transactions – especially to OEMs - where the valuation wasn’t publicly disclosed
[2] BLACKJACKS: Bayer/BASF, UPL, Agco, CNH/FMC, Kubota, John Deere, Corteva, Syngenta
[3] A not insignificant flaw in the above analysis is that almost half the transactions had undisclosed exit prices, however, my expectation is that most of these were small in value and might not even have made my $20m threshold
[4] The structure that defines how the proceeds from an exit are distributed among the different shareholders


